In the realm of precision machining, surface roughness plays a central role in ensuring that parts not only meet dimensional tolerances but also perform reliably over time. This article offers a friendly, third person overview of surface roughness: what it is, how it’s measured, what its common metrics are, and how machining processes influence it. Toward the end, there’s a brief introduction to how Precionn approaches surface roughness in its machining services.
What Is Surface Roughness?
Surface roughness refers to the microscopic texture of a part’s surface, characterized by small deviations from an ideal smooth form. These deviations manifest as peaks and valleys resulting from machining, grinding, polishing, or other surface operations. While sometimes used interchangeably with “surface finish,” strictly speaking surface finish includes lay, waviness, and roughness components; but in most engineering drawings, only roughness is specified or controlled. From a practical standpoint, surface roughness is a fingerprint of the manufacturing process — it’s the “micro landscape” left behind by cutting tools, abrasives, or other processes. In high precision parts, that micro landscape can influence friction, wear, seal performance, fatigue life, coating adhesion, and more.
In industrial settings, typical as-machined surfaces (turning, milling) may exhibit roughness in the micrometer (µm) range; much finer finishes require grinding or polishing. Because roughness is inherently a statistical measure, engineers often sample multiple traces or apply filters to isolate roughness from longer-wavelength waviness or form error.
How to Measure Surface Roughness?

Measuring surface roughness involves probing or imaging the surface and extracting characteristic parameters (Ra, Rz, etc.). Below are common measurement methods and guidelines.
Contact Stylus Profilometry
One of the most widely used methods is mechanical stylus profilometry. A diamond stylus (or similarly hard tip) is drawn laterally across the surface at a controlled speed and pressure. The vertical motion of the stylus records the surface profile over a specified evaluation length. From that profile, various statistical roughness parameters (Ra, Rz, etc.) are calculated.
Key considerations include:
Cutoff length / filter: to separate roughness from waviness.
Sampling length and number of samples: multiple segments may be measured and averaged.
Stylus tip radius and force: must suit the surface geometry and hardness to avoid damage or distortion.
Calibration and standardization: the instrument should follow standards (e.g. ISO 4287/4288 or equivalent).
Optical Methods & Interferometry
Noncontact techniques use light (e.g. white light interferometry, confocal microscopy, focus variation) or laser scanning to reconstruct the surface topography. These methods can capture areal (2D) surface maps, not just profile lines.
Interferometry can achieve nanometer-scale sensitivity for highly polished surfaces.
Focus-variation / confocal systems are well-suited to more textured surfaces with moderate roughness.
Structured light / fringe projection methods may also be used for broader field measurements.
These optical approaches avoid mechanical contact, enabling measurement of delicate surfaces or soft materials where stylus contact may influence the result.
Comparative / Replica Techniques
In some cases, a replica (impression) of the surface is taken (e.g., polymer resin) and then measured optically. This method is useful when direct access is difficult.
Best Practices / Standards
Always report the measurement method, cutoff, and sampling parameters.
For consistency, apply filtering (e.g. Gaussian filters) to separate roughness from waviness.
Use multiple measurement traces to reduce variance.
Compare against recognized standards (ISO, ASME, JIS) to ensure reproducibility.
In practical machining settings, typical instruments measure in ranges: ~0.05 to 10 µm for Ra, ~0.1 to 50 µm for Rz.
What Is Ra in Surface Roughness?
Ra (arithmetic average roughness) is arguably the most common metric used to specify surface roughness in machined parts. It is defined as the arithmetic mean of the absolute deviations of the surface profile from the mean (reference) line over the evaluation length:
Ra=1L∫0L∣z(x)∣ dx\displaystyle Ra = \frac{1}{L} \int_{0}^{L} |z(x)| \, dxRa=L1∫0L∣z(x)∣dx
where z(x)z(x)z(x) are the vertical deviations from the mean line, and LLL is the evaluation length.
Advantages and Limitations
Advantage: Ra is easy to understand and compute; it gives a general sense of “smoothness.”
Limitation: Because it averages all deviations (positive and negative) equally, it may not reflect extreme peaks or valleys that could be critical in sealing or fatigue surfaces. In other words, two surfaces with the same Ra can have very different topographies.
In engineering practice, typical values of Ra for machined surfaces vary. For fine turning or milling, ~0.8 to 3.2 µm is common; for grinding or superfinishing, Ra may drop into the 0.1 to 0.8 µm range or lower.Some rules of thumb suggest approximate relationships (though not precise conversions) between Ra and other parameters like Rz (e.g. Rz ≈ 7×Ra), though real surfaces often deviate from that ratio. Because Ra is so ubiquitous, many engineering drawings simply specify, for example, “Ra ≤ 1.6 µm” without further elaboration.
What Is Rz in Surface Roughness?
Rz is another common roughness parameter that better captures extreme deviations (peaks and valleys). In many international standards, Rz is defined as the average of the vertical distances between the highest peak and lowest valley over several sampling lengths (commonly five). In effect, the process is:
Divide the evaluation length into sub segments (e.g. five segments).
In each segment, identify the highest peak height above the mean and the lowest valley depth below the mean.
Compute the vertical distance peak-to-valley in each segment.
Average those distances: that gives Rz.
Thus, Rz is more sensitive to isolated peaks or deep valleys that might otherwise be masked in an Ra-based average. It is often used in applications where such deviations may have functional implications — for example, in sealing surfaces, fatigue-critical parts, or mated mechanical interfaces.Because Rz focuses on extremes rather than average deviations, it often assumes a higher numerical value than Ra for the same surface. That is, typically Ra < Rz. In some cases, a design drawing might require both Ra and Rz parameters to more completely define the desired surface character.
One common practical rule is that for a “normal” machining surface, Rz might be approximately 6–10 times Ra, but this is approximate and depends heavily on machining process, material, tool conditions, etc.
What Is the Significance of Surface Roughness?
Surface roughness is not just a technical number — it has tangible implications on how a component functions. Below are the major reasons why controlling surface roughness matters.
Friction, Wear, and Contact Mechanics
Rough surfaces tend to have higher friction because microscopic asperities contact each other, increasing resistance. In sliding or rotating parts (bearings, shafts, cams), excessive roughness can accelerate wear or cause unwanted frictional heat. Conversely, surfaces that are too smooth may reduce friction but lose the lubricant-retaining capacity that microscopic valleys provide.
Fatigue Life and Crack Initiation
Surface peaks (asperities) often act as stress concentrators, particularly under cyclic loading. Deep valleys or scratches can be initiation points for cracks. Therefore, in fatigue-sensitive parts (e.g. aerospace, automotive, medical), reducing surface roughness and controlling extreme deviations can markedly improve longevity.
Sealing Surfaces
In sealing applications (e.g. O rings, gaskets, pressure interfaces), the surface must be smooth enough to avoid leakage yet have microstructure to allow sealing contact. Excessive peaks or valleys may impair sealing; too smooth a surface might promote leakage or failure under pressure.
Coating Adhesion & Surface Treatments
When applying plating, painting, or other surface treatments, a controlled roughness profile improves adhesion. Microscopic valleys provide “anchors” for coatings. Too smooth a surface may reduce bonding strength; too rough may trap stresses or defects.
Aesthetics & Optical Surfaces
In consumer parts, visible parts, and precision optics, surface roughness influences how light interacts with the surface (reflection, scattering, gloss). Lower roughness yields better optical qualities. In those cases, very tight surface finishing is essential.
Dimensional Accuracy & Functional Interchangeability
In precision assemblies, surface roughness can affect fit, tolerance, and functional interchange. For example, surfaces intended to slide or align may require tight roughness control to avoid friction or binding.
Manufacturing Cost and Time
Achieving ultra-low roughness often requires slower cutting, lighter depth-of-cut, multiple finishing operations (grinding, polishing), or more inspections. Thus, specifying the smoothest feasible roughness that still meets functional requirements is a cost-optimization decision.
In sum, controlling surface roughness is a key intersection of functionality, reliability, and manufacturability.
Symbolic Representation of Surface Roughness
On engineering drawings and technical specifications, surface roughness is often indicated by standard symbols and notations. Understanding these symbols helps unambiguously communicate requirements.
Surface Roughness Symbols (ISO / ANSI)
A common symbol is a check mark (like a “V” shape) with additional annotations indicating parameters (e.g. Ra value, machining direction, lay).
The basic symbol may include:
The roughness parameter (e.g. Ra ≤ 1.6 µm).
The allowable machining method (e.g. “machining allowed,” or crossed-out “laying / grinding only”).
The direction of lay (arrows or markings showing the dominant micro-groove direction).
In ISO 1302 (or more recent standards), there are more elaborate callout styles: symbols with additional fields to specify upper/lower limits, surface grade, work method, etc. Roughness Grade (N Number)
In some standards (e.g. DIN/ISO), roughness grades are denoted by N1 to N12, which correspond to maximum Ra ranges. For example:
N12 → Ra = 50 µm
N8 → Ra = 3.2 µm
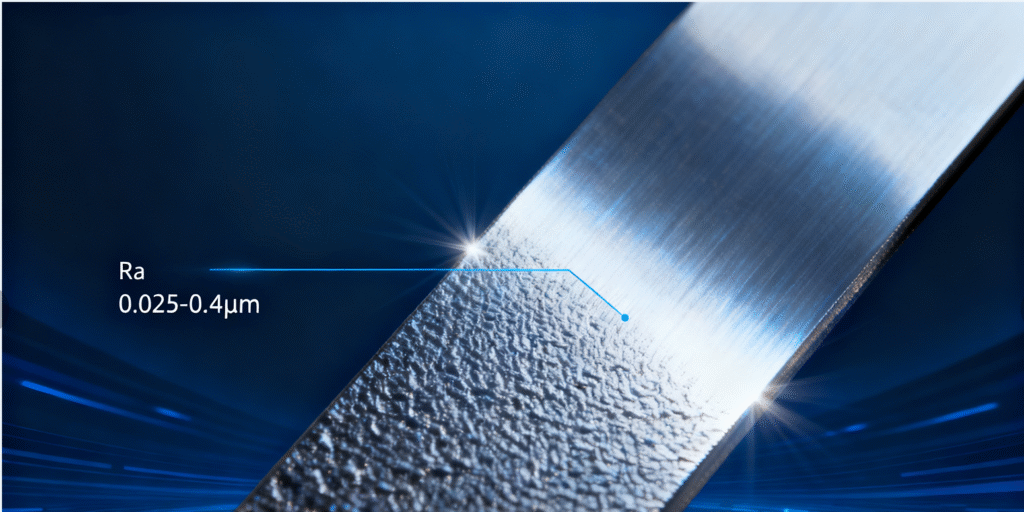
N5 → Ra = 0.4 µm
N1 → Ra = 0.025 µm
These grade numbers are useful shorthand on drawings (e.g. “Surface finish N8”) rather than writing a numeric Ra each time.
Additional Symbols / Qualifiers
U / L (upper / lower): to specify one-sided tolerances (e.g., only an upper roughness limit).
“All texture” or “excluded texture” qualifiers: specify whether certain surface textures (burrs, chamfer edges) are included in measurement.
Lay arrows or patterns: indicating the dominant orientation of surface grooves (e.g. parallel, radial, circumferential).
Superscript or suffix: e.g. “Ra = 1.6 µm” may be annotated next to the roughness symbol.
When generating manufacturing drawings, it’s best practice to include the full meaning (e.g. parameter, permissible range, measurement method reference) to avoid ambiguity.
Relationship Between Machining Technology and Surface Roughness
The surface roughness achieved on a part is intimately linked to the machining method, tool geometry, material properties, and processing parameters. Below is a breakdown of how various machining technologies influence roughness and strategies to optimize it.
Turning
Turning (on a lathe) often produces surfaces with spiral tool marks. The achievable roughness largely depends on:
Feed rate: lower feed tends to produce lower roughness (finer surface).
Depth of cut: lighter cuts reduce tool deflection and vibration.
Tool nose radius: a larger nose radius smooths out transitions but may increase cutting forces.
Tool wear: worn tools degrade surface quality.
Workpiece rigidity & vibration: vibrations (chatter) increase roughness.
Cutting speed: within limits, higher speed may reduce build-up edge and improve finish, but also increases heat.
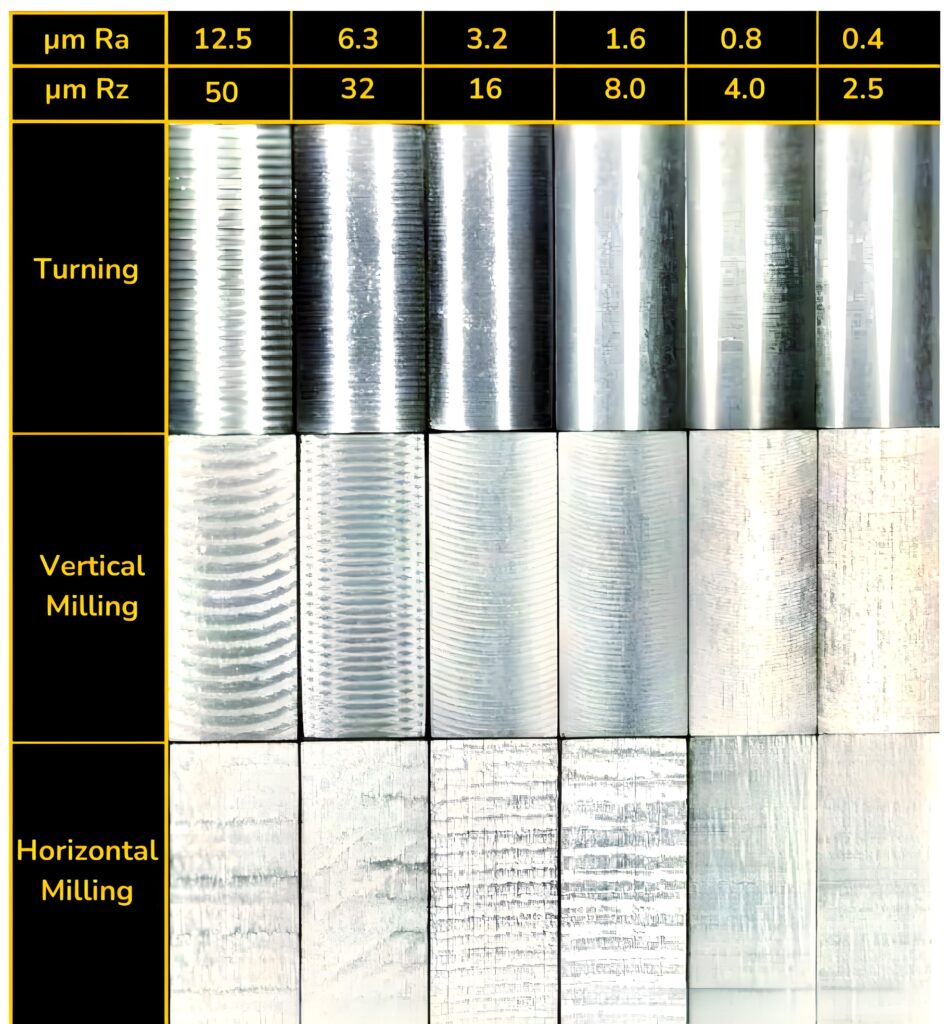
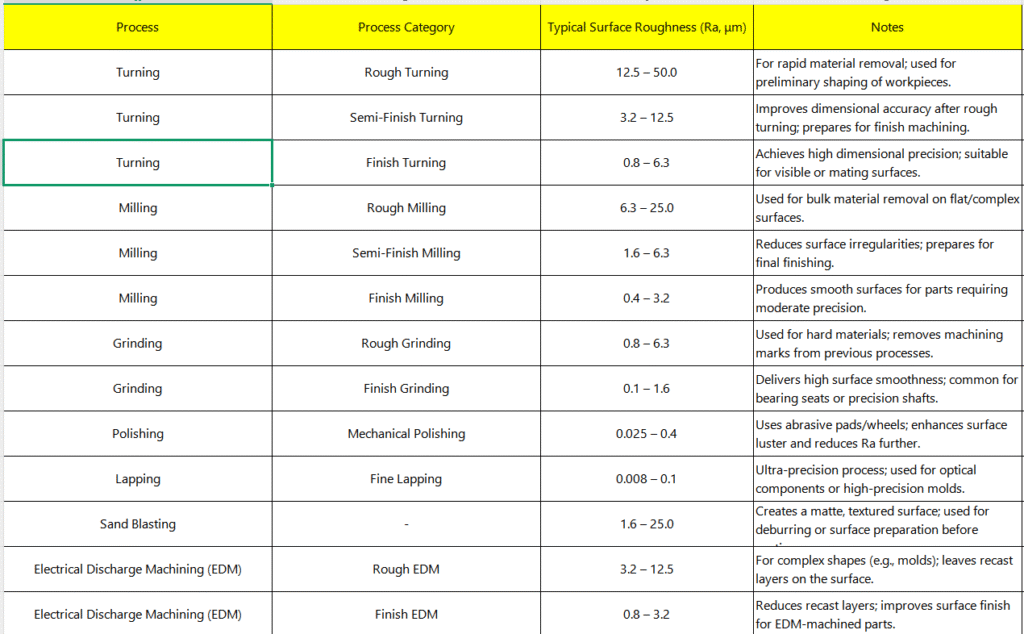
Typical Ra for turning may range from about 1.6 to 6.3 µm under standard conditions.
Milling
Milling introduces intermittent cutting, which can lead to scallop patterns between adjacent tool passes.
Step-over width: smaller step-over reduces scallops and yields smoother surfaces.
Feed per tooth: lower feed-per-tooth gives finer finish.
Tool geometry (helix, coating, edge sharpness): better geometry helps reduce surface defects.
Spindle speed & cutting speed: optimized speed reduces undesirable tool–workpiece interaction.
Tool vibration and chatter: stability is critical.
Cutter runout: minimal runout ensures uniform engagement.
Typical Ra from milling can lie in the range 0.8 to 6.3 µm depending on conditions.
Grinding & Superfinishing
Grinding, especially surface or cylindrical grinding, can yield much finer finishes:
Fine abrasives / micro-grinding: can reach Ra values of 0.1 to 0.8 µm (or lower).
High-precision wheels and dressing: ensuring wheel quality and dressing is essential.
Coolant, feed, speed: these must be smoothly controlled.
Vibration control: machine stiffness, damping, and balancing influence finish quality.
Superfinishing, honing, lapping, or polishing can push roughness even below 0.05 µm in some optical or precision components.
Electrical Discharge Machining (EDM)
EDM produces rough surfaces due to spark erosion, but with fine finishing potentials:
Typical as EDM roughness may be 0.3 to 2.0 µm (with fine finishing approaches).
Secondary polishing or micro-finishing may reduce roughness further.
Other Processes (e.g. Laser, Plasma, Additive)
In nontraditional processes, surface roughness tends to be higher, and post machining or finishing is often required. For CNC finishing of additive parts, secondary milling or grinding often refines surface quality.
Trade-Offs and Constraints
Cost vs finish: achieving ultra-smooth surfaces costs more time, tooling, inspection, and possible rejects.
Tolerance coupling: very tight dimensional tolerances may require ultrafine finishing.
Material behavior: certain materials (brittle, difficult to machine) may limit achievable roughness.
Accessibility and geometry: deep cavities, holes, complex shapes may limit access or tool options; achieving uniform roughness becomes more challenging.
Thermal effects and residual stress: heat and residual stress can distort microstructure and impact finish.
Process Selection Strategy
A pragmatic approach in precision manufacturing is:
Define the functional requirement (e.g. sliding, sealing, cosmetic, fatigue).
Select the roughest acceptable surface that still meets functional needs (to minimize cost).
Design tool paths, feeds, speeds, tool geometry to approach that roughness.
Use finishing operations (grinding, polishing) only where necessary.
Inspect at intermediate stages to confirm roughness goals are met.
Because surface roughness arises from the entire machining chain — from machine dynamics, tool state, cutting conditions, fixturing, and material behavior — continuous monitoring and adjustment are essential to reliably meet specifications.
About Precionn
In the pursuit of precision and quality, Precionn places strong emphasis on surface integrity as well as dimensional accuracy. As a machining enterprise serving international clients, Precionn maintains strict quality control protocols, deploying high-end profilometers, optical surface measurement systems, and feedback loops in manufacturing to ensure that the specified surface roughness is achieved reliably. Whether clients require moderate finishes or ultra-fine surfaces for sealing, bearing, or cosmetic parts, Precionn works closely with them to balance performance, manufacturability, and cost, and delivers parts that fulfill both macro tolerance and micro surface specifications.
If you’d like a consultation on how surface roughness will affect your component’s performance or a quote including roughness control, Precionn’s engineering team is ready to assist.